Chart
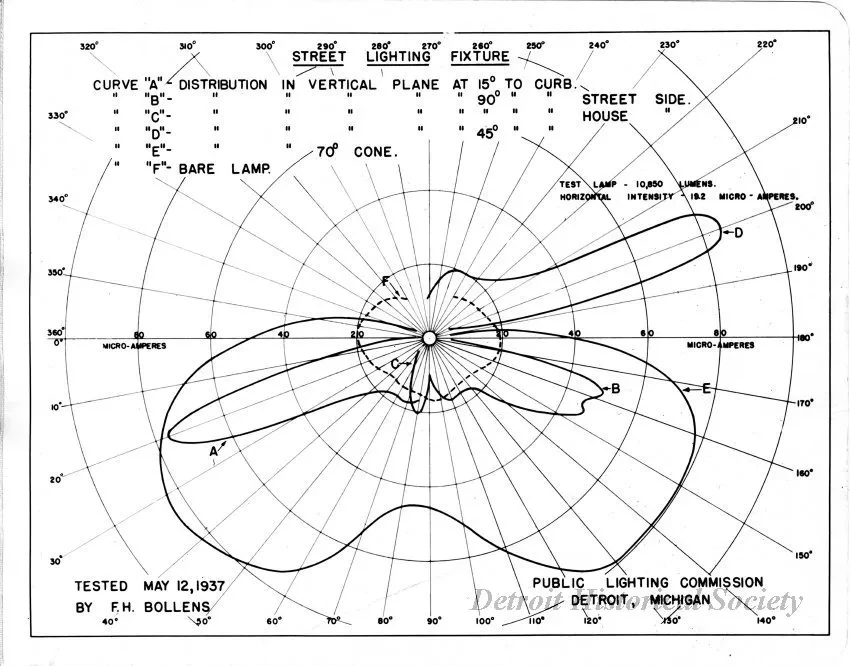
Street Lighting Fixture
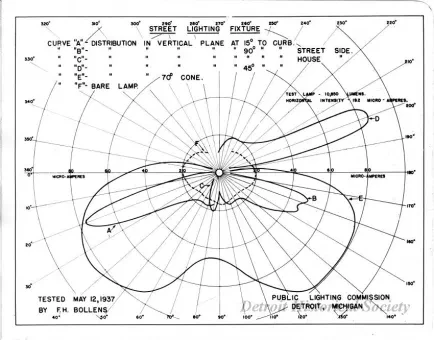
Graph. Mounted black and white polar graph printed on photographic paper entitled, "Street Lighting Fixture." The polar axis is measured in microamperes from 0 to 100. There are six patterns plotted on the graph, labeled A through F. Pattern A is the distribution in vertical plane at 15° to curb. B is the distribution in vertical plane at 90° to curb, street side. C is the distribution in vertical plane at 90° to curb, house side. D is the distribution ion vertical plane at 45° to curb. E is the distribution in a 70° cone. And F represents the pattern from a bare lamp. The chart notes that the test lamp was 10,850 lumens and gave 19.2 microamperes horizontally. These tests were done by F.H. Bollens of the Public Lighting Commission on May 12, 1937. The graph is matted on a page with a flexible margin on the left, presumably for binding into a report.
Request Image