Transparency, Lantern-slide
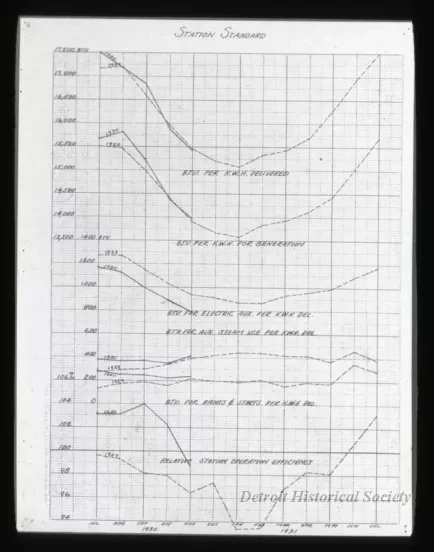
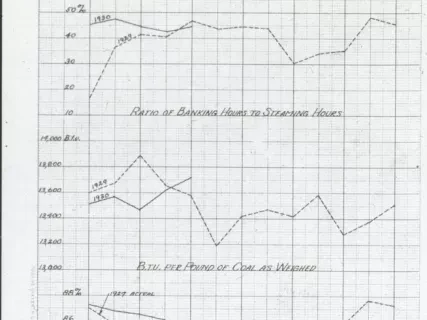
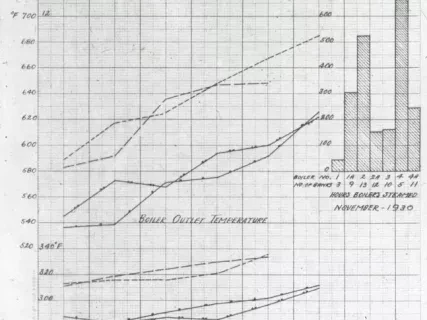
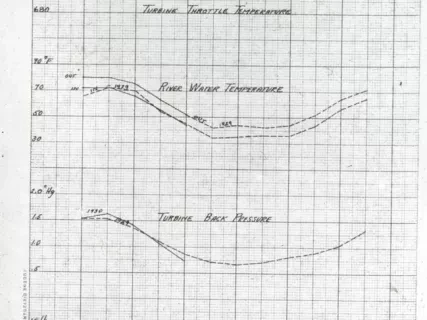
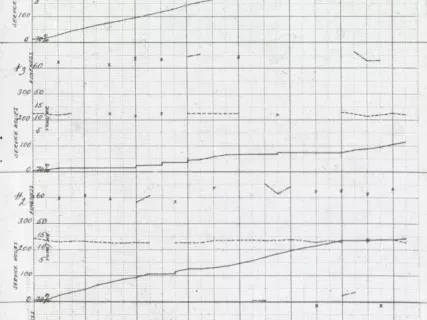
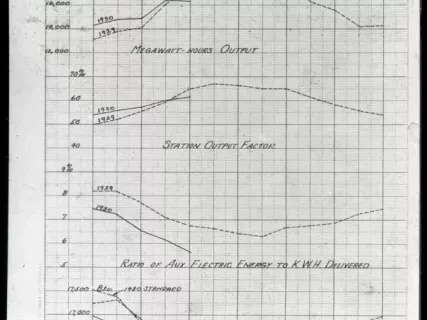
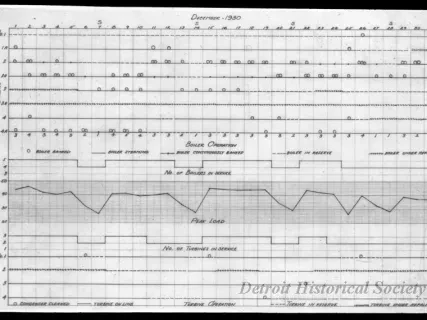
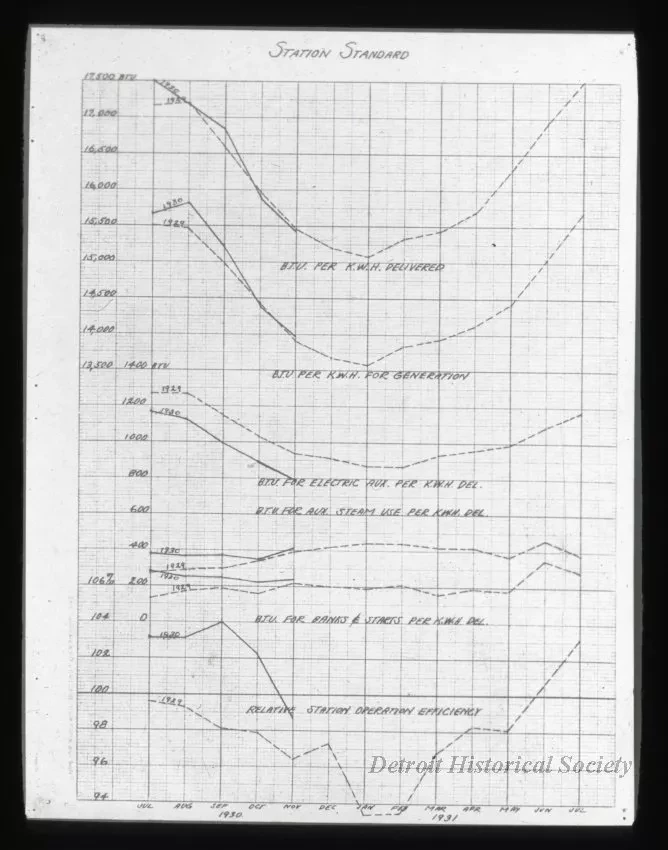
Glass Lantern-Slide. Bears a line graph titled "Station standard." The x-axis is labeled with the months from July of 1930 to July of 1931. The y-axis is divided into three sections. The bottom section contains two lines--one marked 1929, and the other marked 1930--which indicate "Relative Station Efficiency." The y-axis ranges from 94 to 104 percent. According the chart the in 1929 station operated at its peak in the summer, and less so in the winter. The 1930 line only spans from July to November, but similarly slants downward. The central area of the y-axis is labeled from 200 to 1400 British Thermal Units. It includes three pairs of lines. The lowest ones are labeled, "B.T.U. for Banks & Starts per K.W.H. Del." The 1929 line peaks in June at about 350, and the 1930 line ends in November. The center lines represent "B.T.U. for Aux. Steam Use per K.W.H. Del." The 1929 line ranges from 200 to 450, peaking in January and June. The 1930 line is again partial, but within slightly higher ranges. "B.T.U. for Electric Aux. per K.W.H. Del." is at the top of the center section. The 1929 line again peaks in the winter, around 1300, and valleys in the summer below 900. The 1930 line is again partial but follows the same trend, albeit slightly lower. The top section contains two pairs of lines, measured from 13,500 to 17,500 Btu. The lower set represent "B.T.U. per K.W.H. for Generation." The 1929 line once again peaks in the summer and valleys in the winter ranging from about 15,750 to 13,600 Btu. 1930 begins slightly higher, then follows closely. "B.T.U. per K.W.H. delivered. 1929 and 1930 follow the same trends as before, although much higher--17,500 in the summer and 15,000 in the winter. "29" is handwritten on a sticker affixed to the recto. A portion of another graph was misprinted on the verso of the slide. The y-axis is divided into four sections, each marked "Service Hours." The edge of the slide is covered in black tape.
Request Image