Transparency, Lantern-slide
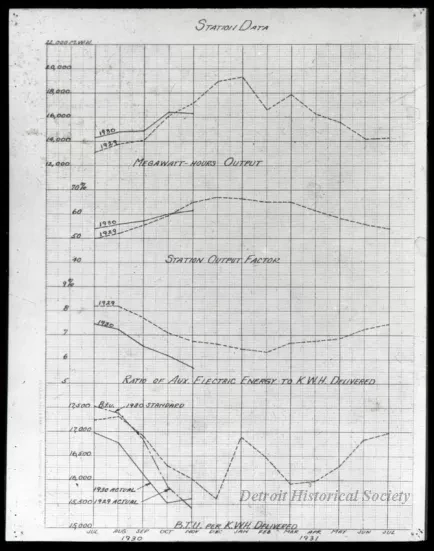
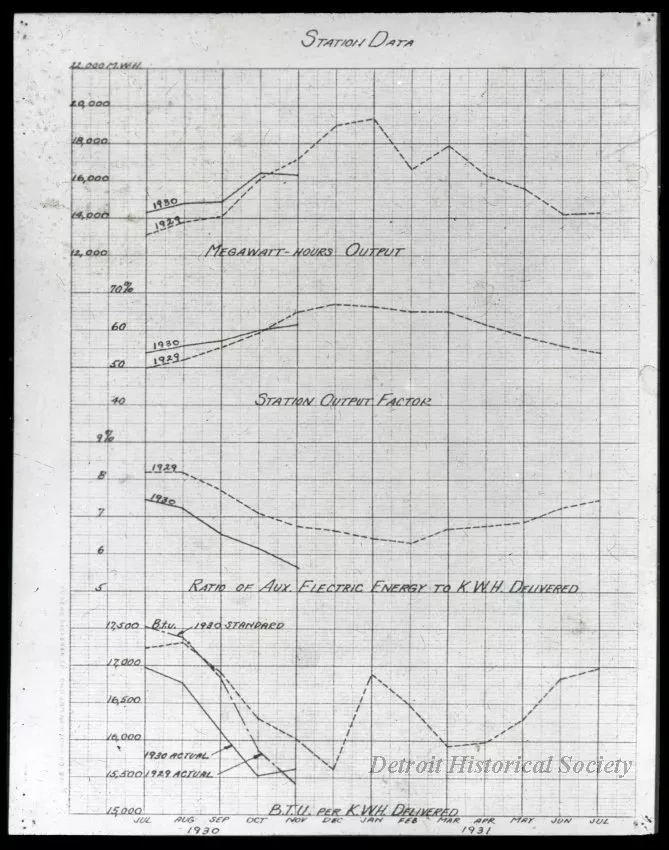
Glass Lantern-Slide. Bears a line graph titled "Station standard." The x-axis is labeled with the months from July of 1930 to July of 1931. The y-axis is divided into four sections. The bottom section contains three lines--1929 actual, 1930 actual, and 1930 standard--which indicate "B.T.U. per K.W.H. Delivered." The y-axis ranges from 15,000 to 17,500 Btu. According the 1930 standard line, the station generated the most heat in June, with a sharp spike in January. Both actual lines follow a similar trend, but only cover from June to November. The second area of the y-axis is labeled from 5 to 9 percent. It includes three pairs of lines. This section is entitled, "Ratio of Aux. Electric Energy to K.W.H. Delivered." Lines are plotted for 1929 and 1930. In 1929 the ratio was highest in the summer, and lowest in February. 1930 is again, only partially graphed, but follows a similar, but lower trend. "Station Output Factor" is the next section. The y-axis here is labeled from 40 to 70 percent. 1929, and partially 1930 are again plotted. The output is highest in the winter, peaking near 66%, and lowest in the summer. "Megawatt-Hours Output." is at the top of the graph. The graph accounts for 12,000 to 22,000 mWh. In 1929 this number peaked about 19,000 in January. 1930 is again partial but follows closely. "20" is handwritten on a sticker affixed to the recto. The edge of the slide is covered in black tape.
Related Records

Transparency, Lantern-slide
2005.068.001Photo
Transparency, Lantern-slide
2005.068.002Photo
Transparency, Lantern-slide
2005.068.003Photo
Transparency, Lantern-slide
2005.068.004Photo
Transparency, Lantern-slide
2005.068.005Photo

Transparency, Lantern-slide
2005.068.006Photo
Transparency, Lantern-slide
2005.068.007Photo
Transparency, Lantern-slide
2005.068.008Photo

Transparency, Lantern-slide
2005.068.009Photo

Transparency, Lantern-slide
2005.068.010Photo

Transparency, Lantern-slide
2005.068.011Photo
Transparency, Lantern-slide
2005.068.012Photo
Transparency, Lantern-slide
2005.068.013Photo

Transparency, Lantern-slide
2005.068.014Photo
Transparency, Lantern-slide
2005.068.015Photo
Transparency, Lantern-slide
2005.068.016Photo

Transparency, Lantern-slide
2005.068.017Photo
Transparency, Lantern-slide
2005.068.018Photo
Transparency, Lantern-slide
2005.068.019Photo

Transparency, Lantern-slide
2005.068.020Photo

Transparency, Lantern-slide
2005.068.021Photo
Transparency, Lantern-slide
2005.068.022Photo
Transparency, Lantern-slide
2005.068.023Photo

Transparency, Lantern-slide
2005.068.024Photo
Transparency, Lantern-slide
2005.068.025Photo
Transparency, Lantern-slide
2005.068.026Photo
Transparency, Lantern-slide
2005.068.027Photo

Transparency, Lantern-slide
2005.068.028Photo
Transparency, Lantern-slide
2005.068.029Photo
Transparency, Lantern-slide
2005.068.030Photo
Transparency, Lantern-slide
2005.068.031Photo
Transparency, Lantern-slide
2005.068.032Photo
Transparency, Lantern-slide
2005.068.033Photo

Transparency, Lantern-slide
2005.068.034Photo

Transparency, Lantern-slide
2005.068.036Photo

Transparency, Lantern-slide
2005.068.037Photo

Transparency, Lantern-slide
2005.068.038Photo
Transparency, Lantern-slide
2005.068.039Photo
Transparency, Lantern-slide
2005.068.040Photo

Transparency, Lantern-slide
2005.068.041Photo
Transparency, Lantern-slide
2005.068.042Photo

Transparency, Lantern-slide
2005.068.043Photo
Transparency, Lantern-slide
2005.068.044Photo
Transparency, Lantern-slide
2005.068.045Photo
Transparency, Lantern-slide
2005.068.046Photo
Transparency, Lantern-slide
2005.068.047Photo
Transparency, Lantern-slide
2005.068.048Photo

Transparency, Lantern-slide
2005.068.049Photo
Transparency, Lantern-slide
2005.068.050Photo
Transparency, Lantern-slide
2005.068.051Photo
Transparency, Lantern-slide
2005.068.052Photo
